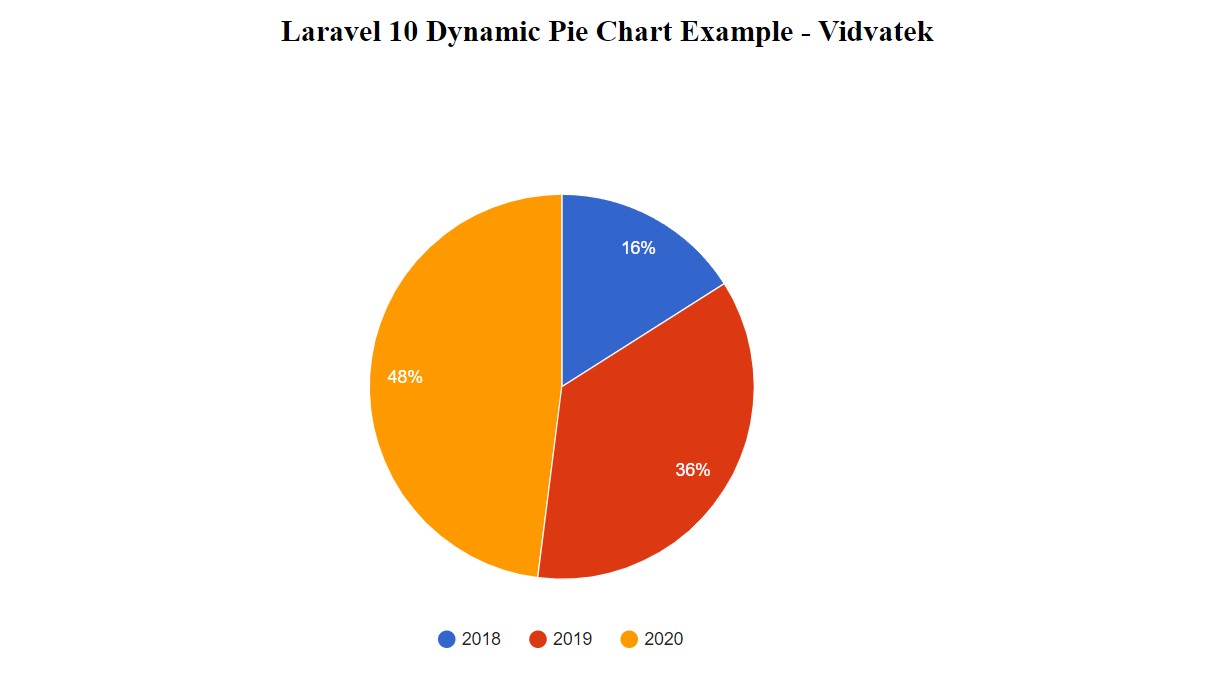
In the dynamic world of web development, data visualization is the key to unlocking the stories hidden within our datasets. In this pursuit, Google Charts emerges as a powerful tool, offering a variety of visually appealing chart types that elegantly present complex information.
One such chart type is the Google Pie Chart – a deliciously informative way to showcase data distribution.
In this article, we embark on a journey of data presentation as we delve into the world of Google Pie Charts within the context of Laravel 10.
As the latest incarnation of the renowned PHP framework, Laravel 10 continues to offer developers a robust platform for crafting web applications with flair and efficiency.
By combining the intuitive capabilities of Google Charts with the versatility of Laravel 10, we open doors to creating interactive pie charts that offer a visual understanding of data proportions.
Whether you're an accomplished Laravel developer looking to add visual flair to your data displays or a newcomer with a passion for insightful visuals, this guide is tailored for you.
We'll guide you step by step – from preparing your Laravel environment to crafting a Google Pie Chart that seamlessly integrates into your application.
As we journey together, you'll gain a comprehensive understanding of how to fuse Google Charts with Laravel 10, transforming your data into compelling, easy-to-understand visuals.
So, let's delve into the art of data presentation. With Laravel 10 as our canvas and Google Pie Charts as our paintbrush, we'll create a canvas that tells a story with each slice.
Begin by setting up a new Laravel project if you don't already have one. Open your terminal and execute the following command
composer create-project --prefer-dist laravel/laravel GooglePieChartExample
We are getting dynamic data for the pie chart example. So first, we need to create a migration for the "product" table using Laravel php artisan command.
php artisan make:migration create_products_table --create=products
After running this command you will find a php file in this location "database/migrations/" In this file you need to add the below code.
<?php

use Illuminate\Database\Migrations\Migration;
use Illuminate\Database\Schema\Blueprint;
use Illuminate\Support\Facades\Schema;

class CreateProductsTable extends Migration
{
    public function up()
    {
        Schema::create('products', function (Blueprint $table) {
            $table->id();
            $table->string('name')->nullable();
            $table->integer('price')->nullable();
            $table->integer('year')->nullable();
            $table->string('product_type')->nullable();
            $table->timestamps();
        });
    }
    public function down()
    {
        Schema::dropIfExists('products');
    }
}
After this, we need to run this migration by the following command in our terminal.
php artisan migrate
And after migration, you need to add some records as per the below screen print.
Create a new route and controller to handle your chart data. Open the routes/web.php file and add a route.
Route::get('piechart', 'PiechartController@piechart');
After adding the route we need to create a new controller and model for the Google Pie chart example. So, type the below command in your terminal to create the controller.
php artisan make:controller PiechartController
php artisan make:model Product
Now add the below code in your PiechartController.
<?php

namespace App\Http\Controllers;

use Illuminate\Http\Request;
use App\Model\Product;

class PiechartController extends Controller
{
    public function piechart(Request $request)
    {
    	$phone_count_18 = Product::where('product_type','phone')->where('year','2018')->get()->count();
    	$phone_count_19 = Product::where('product_type','phone')->where('year','2019')->get()->count();
    	$phone_count_20 = Product::where('product_type','phone')->where('year','2020')->get()->count();

    	$laptop_count_18 = Product::where('product_type','laptop')->where('year','2018')->get()->count();
    	$laptop_count_19 = Product::where('product_type','laptop')->where('year','2019')->get()->count();
    	$laptop_count_20 = Product::where('product_type','laptop')->where('year','2020')->get()->count();

    	$tablet_count_18 = Product::where('product_type','tablet')->where('year','2018')->get()->count();
    	$tablet_count_19 = Product::where('product_type','tablet')->where('year','2019')->get()->count();
    	$tablet_count_20 = Product::where('product_type','tablet')->where('year','2020')->get()->count();

    	return view('piechart',compact('phone_count_18','phone_count_19','phone_count_20','laptop_count_18','laptop_count_19','laptop_count_20','tablet_count_18','tablet_count_19','tablet_count_20'));
    }
}
Create a new blade view, e.g., pie.blade.php, in the resources/views folder. Include the necessary HTML structure to render the Google pie Chart.
<html>
<head>
    <title>Laravel 10 Google Pie Chart Example - Vidvatek</title>
    <script type="text/javascript" src="https://www.gstatic.com/charts/loader.js"></script>
</head>
<body>
    <h2 style="margin:50px 0px 0px 0px;text-align: center;">Laravel 10 Google Pie Chart Example - Vidvatek</h2>
    <div id="piechart" style="width: 900px; height: 500px; margin-left: 235px"></div>
    <script type="text/javascript">
        var phone_count_18 = <?php echo $phone_count_18; ?>;
        var phone_count_19 = <?php echo $phone_count_19; ?>;
        var phone_count_20 = <?php echo $phone_count_20; ?>;

        var laptop_count_18 = <?php echo $laptop_count_18; ?>;
        var laptop_count_19 = <?php echo $laptop_count_19; ?>;
        var laptop_count_20 = <?php echo $laptop_count_20; ?>;

        var tablet_count_18 = <?php echo $tablet_count_18; ?>;
        var tablet_count_19 = <?php echo $tablet_count_19; ?>;
        var tablet_count_20 = <?php echo $tablet_count_20; ?>;

        google.charts.load('current', {'packages':['corechart']});
        google.charts.setOnLoadCallback(drawChart);
        function drawChart() {
             var data = google.visualization.arrayToDataTable([
          ['Year', 'Phone', 'Laptop', 'Tablet'],
          ['2018',  phone_count_18, laptop_count_18, tablet_count_18],
          ['2019',  phone_count_19, laptop_count_19, tablet_count_19],
          ['2020',  phone_count_20, laptop_count_20, tablet_count_20]
        ]);
            var options = {
                curveType: 'function',
                legend: { position: 'bottom' }
            };
            var chart = new google.visualization.PieChart(document.getElementById('piechart'));
            chart.draw(data, options);
        }
    </script>
</body>
</html>
Output:

You might also like:
- Read Also: How To Create Dynamic Pie Chart In Laravel 10
- Read Also: Laravel 10 Toastr Notification Example
- Read Also: How To Export CSV File In Laravel 10 Example
- Read Also: How to Send Email with PDF Attachment in Laravel 10